Analyze, Transform, and Prepare Your Data — All in One Platform
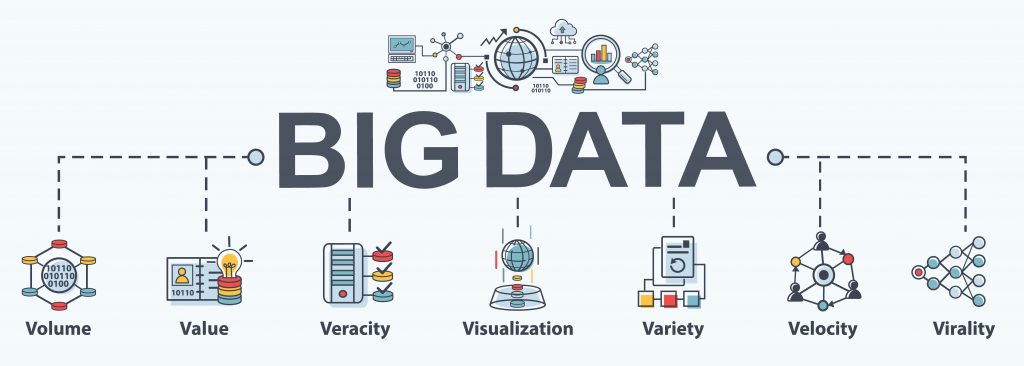
Big data applications are 10X more complex than regular apps, and developers often need to know a plethora of technologies just to make big data work. A big part of the complexity in big data is about the software required to grok it all. Though Spark and other, newer systems have improved the trajectory, big data infrastructure remains way too hard. Compounding the difficulty, is the need to understand the wide array of systems involved. You might need to know 10 technologies to build a big data application, for example, but that likely requires you to have some familiarity with another 20 technologies simply to know which one to use in a given situation. Otherwise, for example, how are you going to know to use MongoDB instead of Hbase? Or Cassandra? Or neo4j? Gartner suggests that 70% of Big Data deployments will not meet cost savings & revenue generation objectives due to skills & integration challenges. The ever-evolving Big Data Ecosystem & escalating costs of skilled professionals, is making it harder to realize the Promise of Big Data and organizations are hard pressed to search for a safer approach.
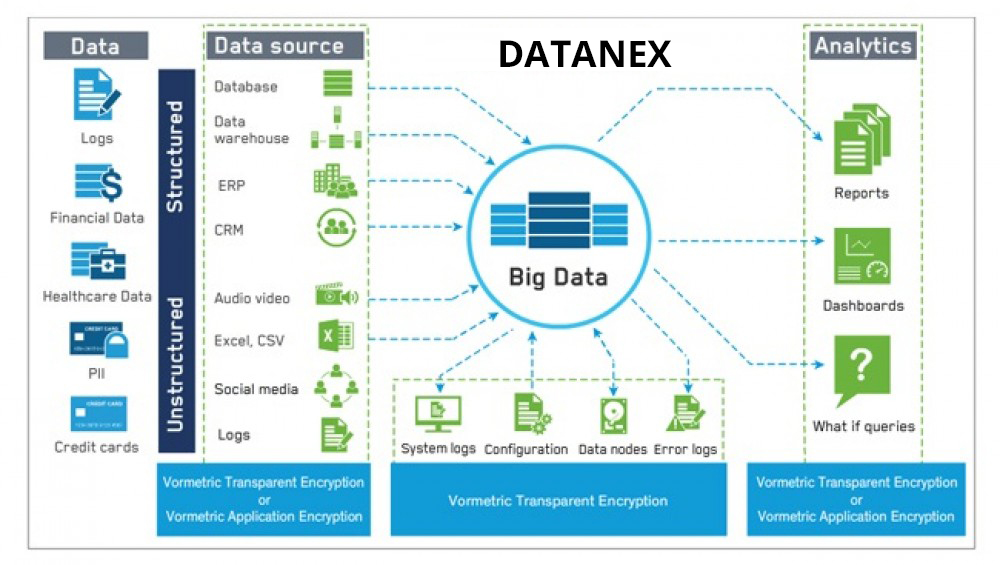
With Datanex as a core of our soltuion, we are here to abstract the complexity of Big Data and be the only application needed to put the power of big data analytics directly into the hands of those who know their data best. Datanex is the only end-to-end big data analytics application purpose-built for Big Data and hundreds of customers, including CIOs, CMOs, CTOs, doctors, scientists, law enforcement officials, and even olympic athletes, are all relying on Datanex to help them get from raw data to insight faster than ever. We have also architected our solution with the future in mind. As the big data landscape continues to evolve, our open architecture means your investment is protected as new systems and standards are introduced.
While the traditional approach to Big Data Analytics requires stitching together multiple disparate components and using manual methods for data ingestion, Datanex leverages ready-made connectors, a big library of pre-built analytical functions and requires no coding at all. Its “point & click” analytics and “drag & drop’ visualizations, truly empower business users with no coding skills. And that is why our approach of relying on a proven, integrated end-to-end solution of Datanex, is a better approach.
A self service tool for non-technical end users to take advantage of Big Data cluster for their reporting and analysis needs with no dependence on IT
Ingest and integrate data in days rather than in months, by leveraging our 70+ pre-built data connectors
NO ETL. Our “Schema on Read” is a breakthrough technology that is a game changer and will help you generate new reports with no changes to schema.
Our solution can completely replace an existing legacy data warehouse or can be used to just offload some of the work-load from an existing data warehouse.
Future proof your Big Data architecture with Datanex. Our open architecture ensures your investment is protected as the big data landscape continues to evolve.
Easy integration with other self-service analytics and visualization tools like Tableau, Qlik, Tibco, Microsoft BI, etc.

Getting your data into Datanex is as simple as picking your data store from a drop-down menu of 70+ common sources and selecting how – and when – you want to pull your data. Big or small, structured or unstructured, a one-time upload or scheduled to pull every minute. All data is welcome; schemas are not required. There are no second-class data sources. With 70+ connectors to the most common ones and an SDK for those less-common, Datanex lets you load structured, semi-structured and unstructured data from any source with ease. Datanex provides fully automated partitioning, compaction, compression and other services that can easily tame even your largest data sets. Incremental data loading can be configured with time- or data-driven triggers, or can connect with existing job scheduling and monitoring tools to ensure you’ve captured every record. Datanex’s fault-tolerance features include email alerts and detailed reports, and they filter out corrupt, dirty and incomplete data, based on configurable thresholds.

Data Visualization in Datanex is through it’s self-service Business Infographic Designer. Unlike traditional dashboards, Datanex Business Infographic Designer provides you with dozens of chart and graph types, as well as other widgets that you can simply drag and drop onto a blank HTML5 canvas to design beautiful infographics or reports that are consumable on any device. Analysts can also choose to work with any of their favorite Big Data Tools in conjunction with Datanex. Analysts can integrate, prepare and analyze all of their structured and unstructured data in Datanex and then send the results to their favorite analysis and BI tools to augment their traditional reporting and visual discovery capabilities. Build data pipelines and export the results to Tableau, Microsoft Power BI, Qlik, Tibco, Excel, etc.
With Datanex’s self-service analytics, you can perform all the steps yourself – integration, preparation, analysis, visualization and operationalization. Datanex's big data analytics software includes more than 270 point-and-click analytic functions, plus filters, sort and advanced join functionality, allowing you to build everything from a simple report to the most complex analysis. Every analysis you build is a different view on the data, meaning the actual raw data in HDFS is left untouched. . This will speed your analysis and help you deliver more answers to the business. Its breakthrough technologies like “schema on read”, are indeed a game changer. As a result, with Datanex, we can take you from Data to Decisions to Dollars in 90 days or less.